self-initiatedOne Book, Many Readings/Nostalgia and finite state machines
| website | samizdat.co/cyoa |
| year | 2009 / 2022 |
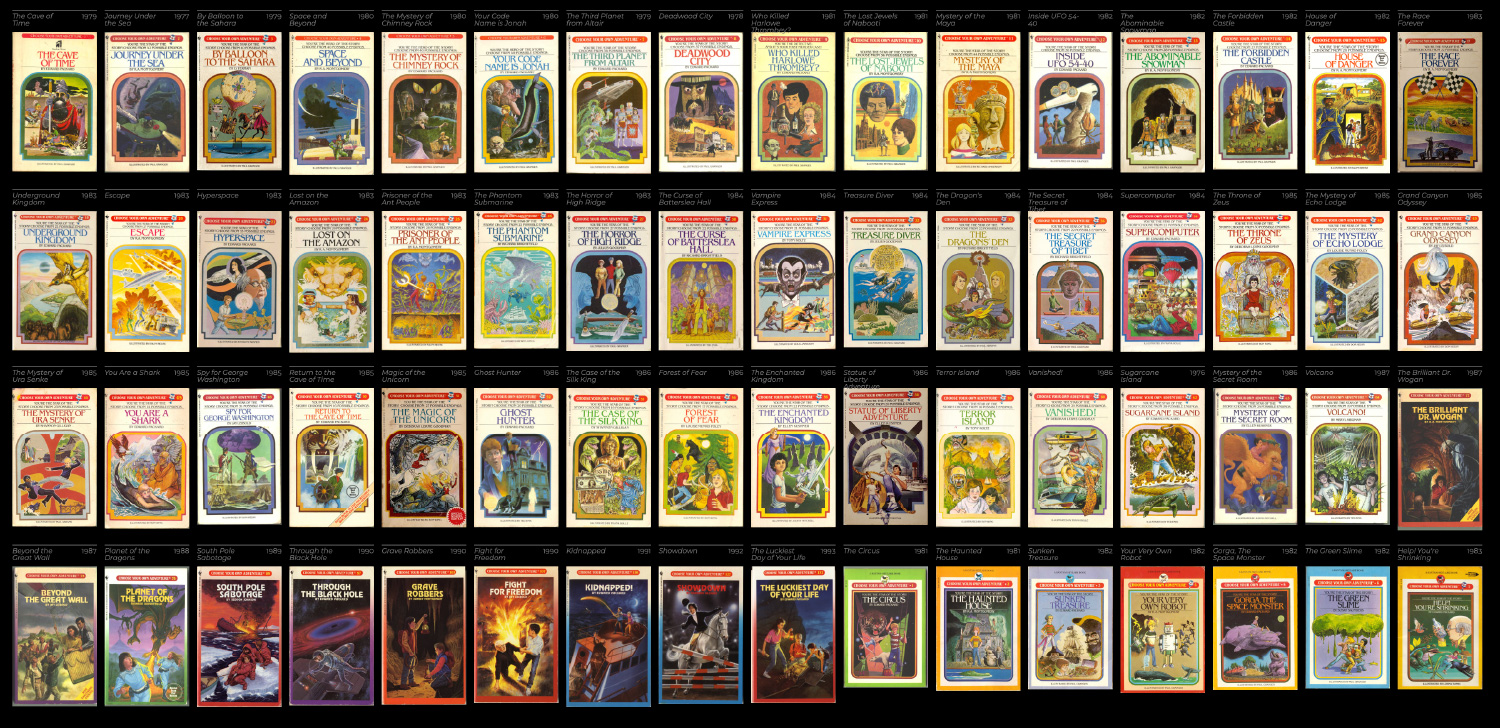
As a child I whiled away countless hours lost in Choose Your Own Adventure books. At the time they just felt different from the other books I’d read. In retrospect it’s clear that the difference was that these were an early form of what we’d now call ‘interactive’ entertainment; albeit embodied in technology that had been around since Gutenberg. This project examines the choices made by those trying to build this kind of proto-game while having only pages, ink, and cross references to work with.
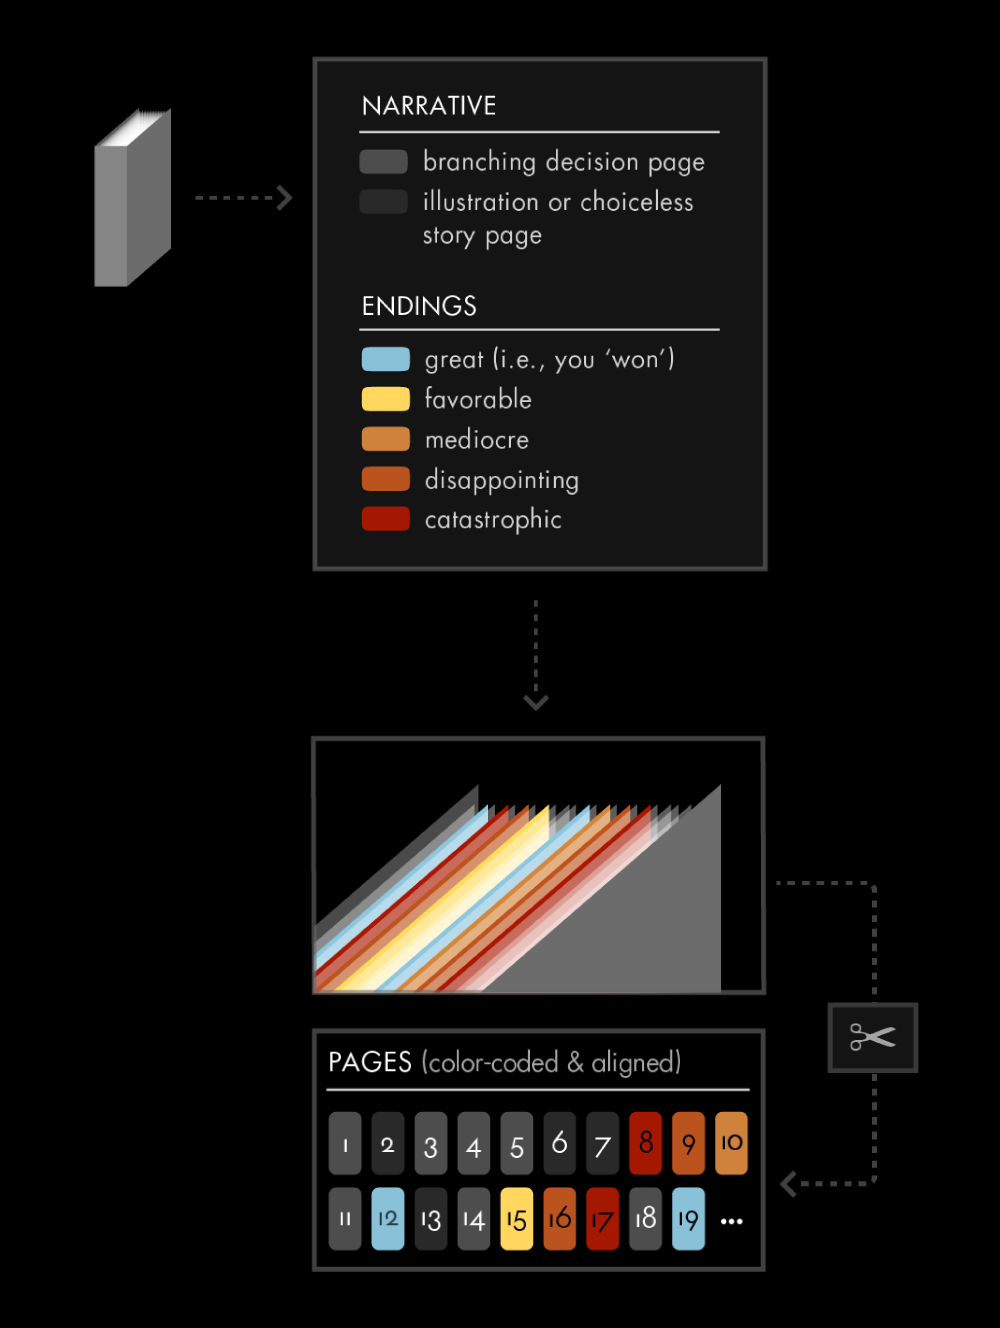
To analyze the structure of the book as a whole, it must first be digested into analyzable chunks. The approach is to categorize each page as either a part of the story (grey) or an ending to a particular reading (red if bad, blue if good). The pages can then be arranged to view the book as a grid of waypoints and terminals.
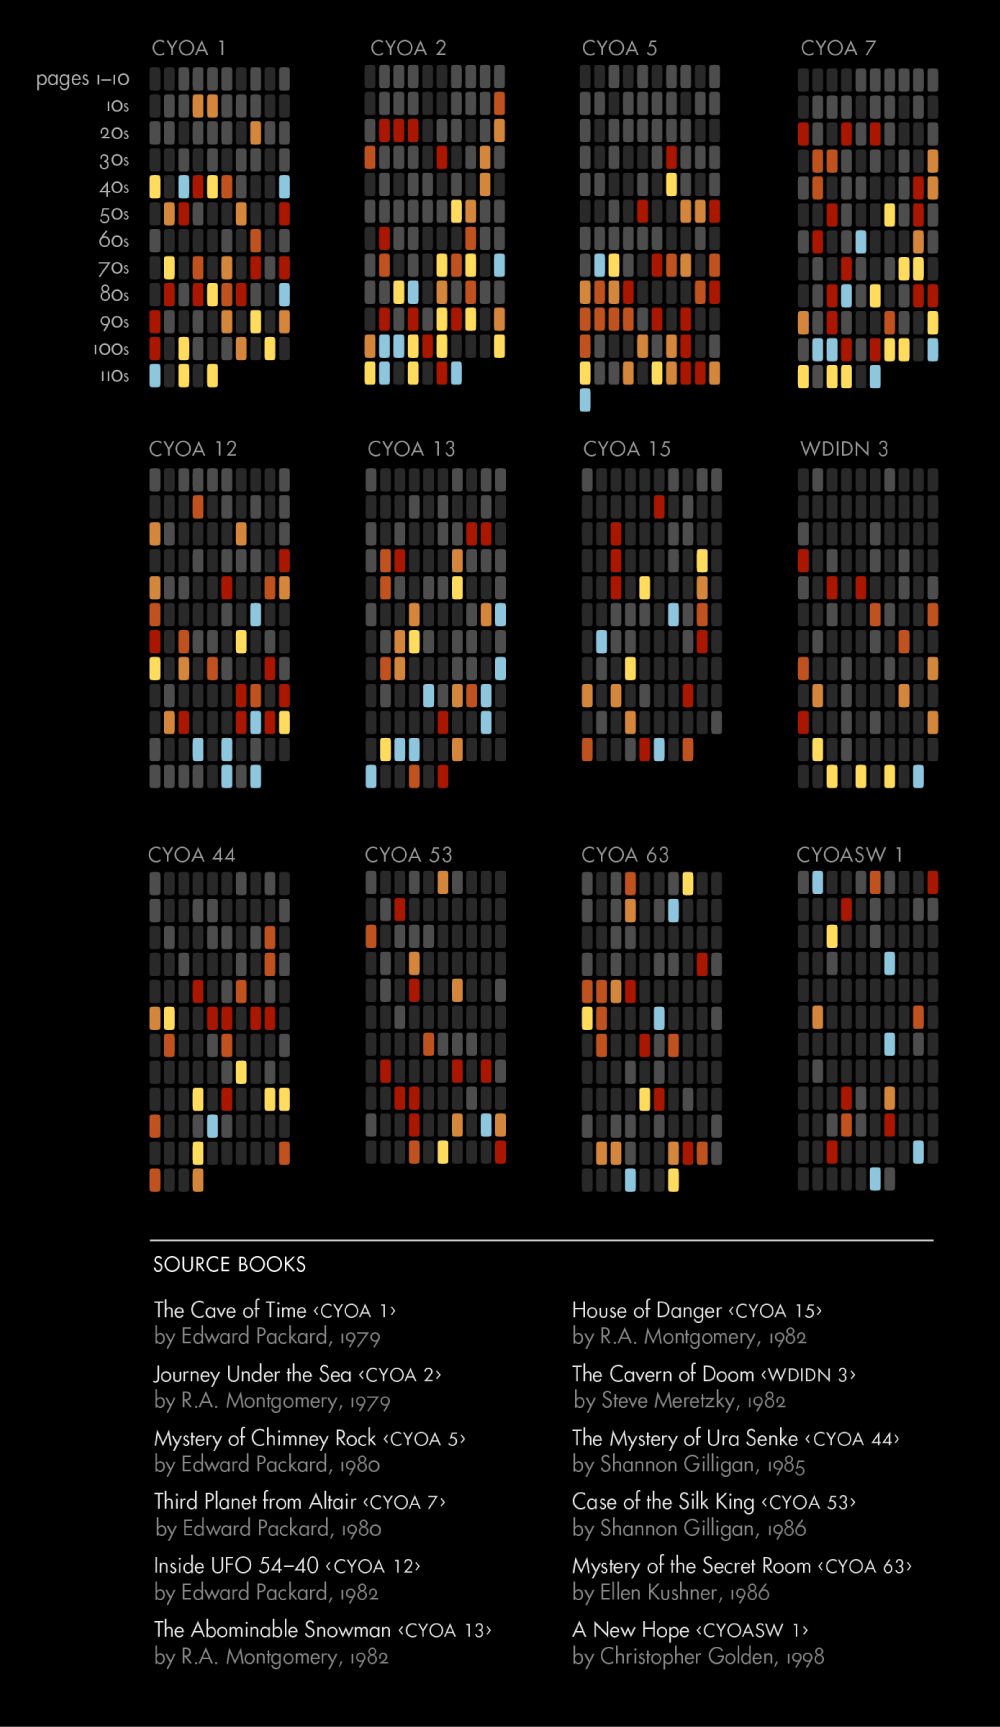
Books from different vintages compared. Note the general decline in number of colored ending pages from the earliest books at the top to the more recent ones below.
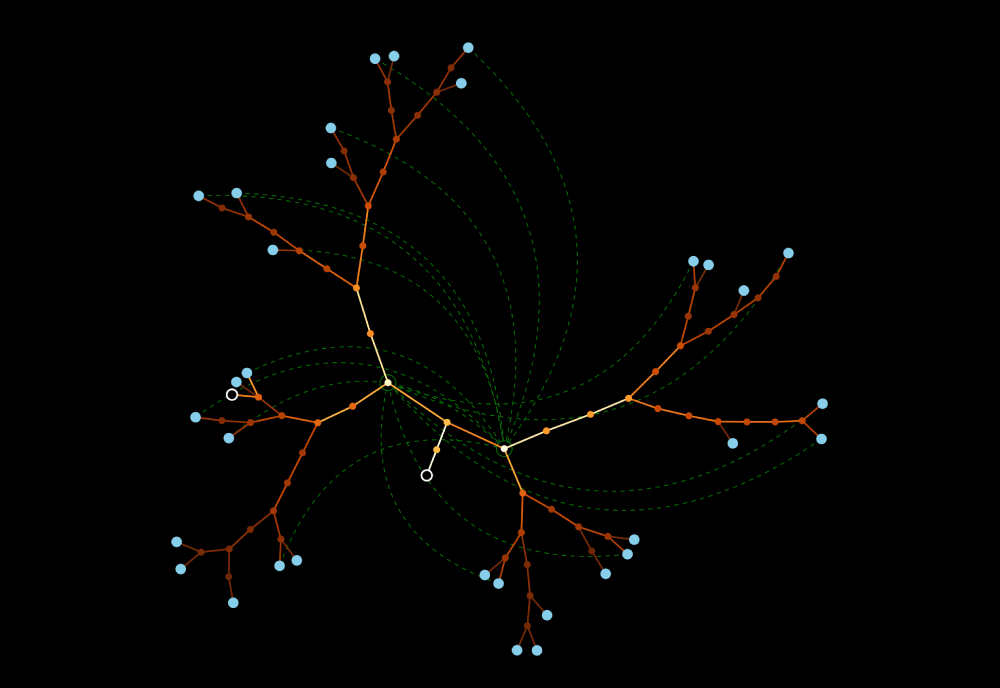
The branching paths of the book can be drawn as a tree of decisions connecting one choice to the next. The most direct paths to an ending are drawn in shades of red and yellow, while choices that jump from one branch to another are dotted green lines.
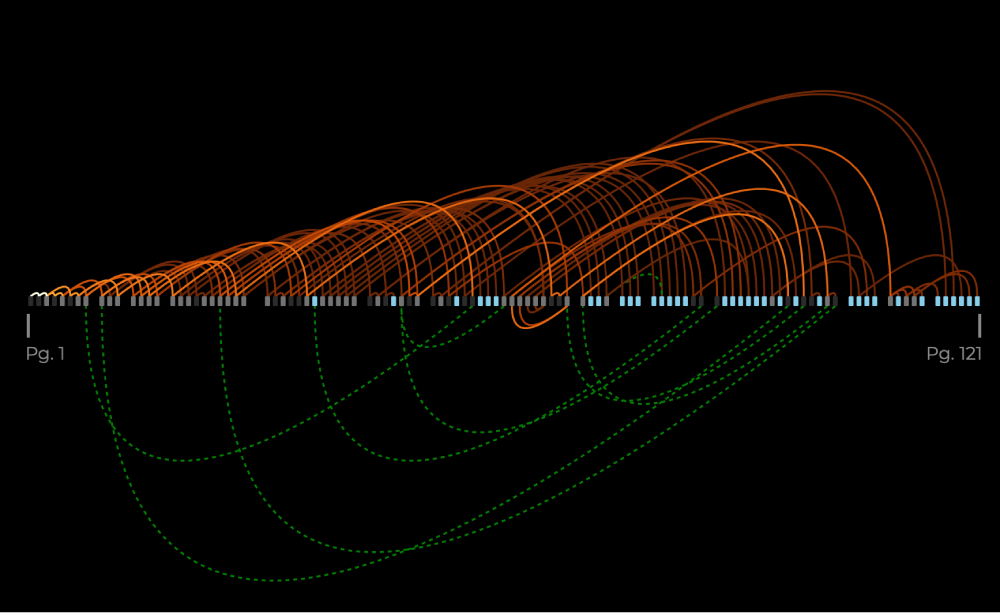
This animation shows all the possible paths through the book, each represented as a faint dot. When turning to a later page in the book, the dot travels in an upward arc. When flipping backward, the dot travels below the line. The pages in the middle of the diagram are color-coded to indicate whether they are endings (good or bad) or decisions.
self-initiatedInfinite Digest/a radically condensed history
| website | samizdat.co/projects |
| year | 2021 |
I first read David Foster Wallace’s mammoth novel, Infinite Jest, as a grad student during my time living in Somerville, Massachusetts. It was hard not to be dazzled by the surface-level details, particularly the exquisite language and a bracingly parodic view of American culture that felt like a periscope pointed at the 21st century four years ahead of time. But even in that initial reading, it was clear that something deeper was at work in terms of its structure and the way it used the form of the book as part of the experience.
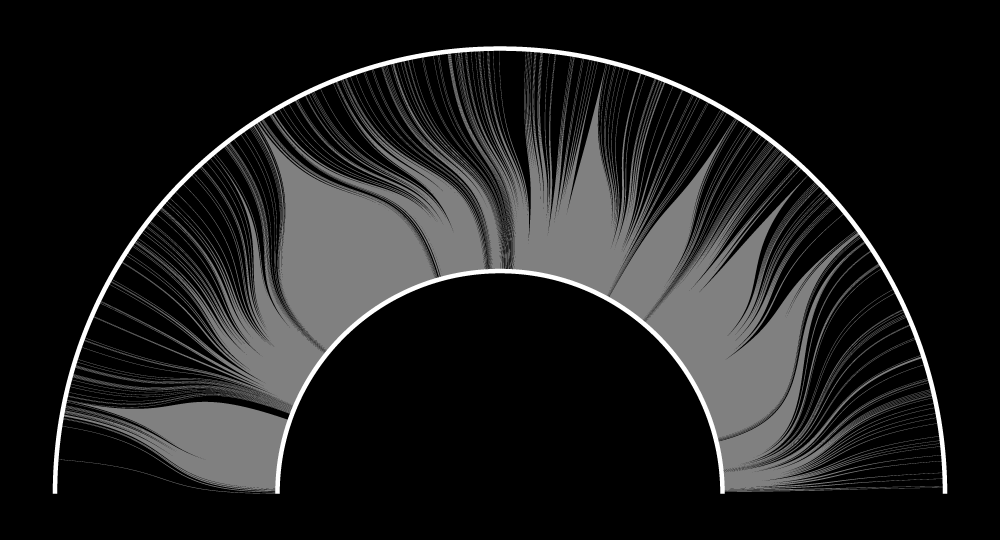
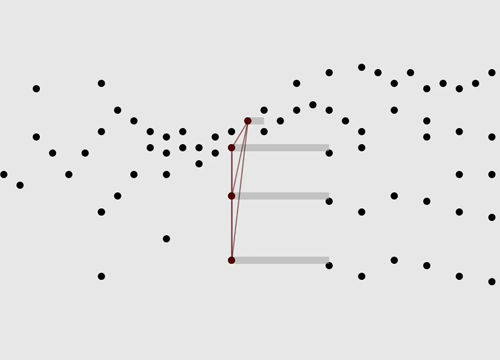
The book famously has 96 pages of endnotes that are referenced over the course of the 981 page main novel. Each of the grey lines connects the point in the story (the outer white arc) where a note is referenced to the region of the backmatter (the inner white arc) occupied by the note itself
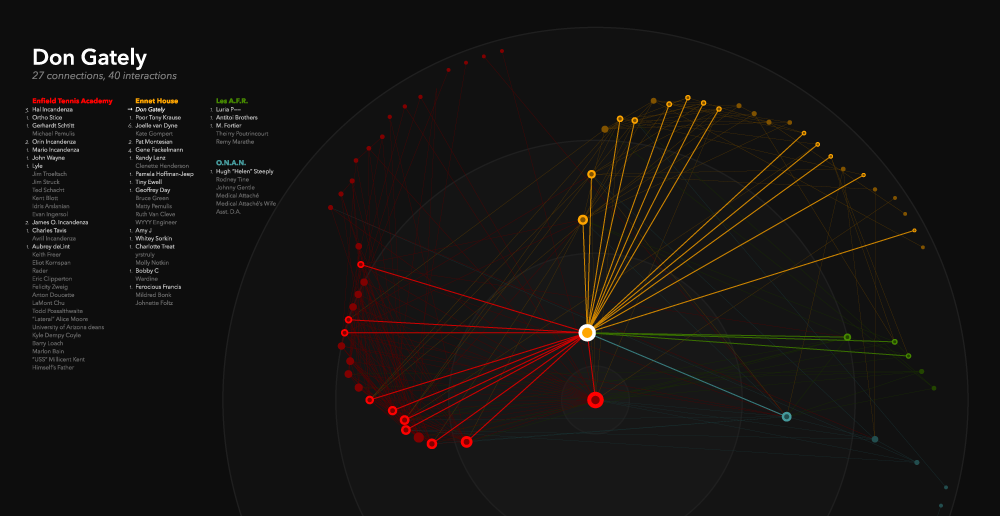
Examining the social networks of each character
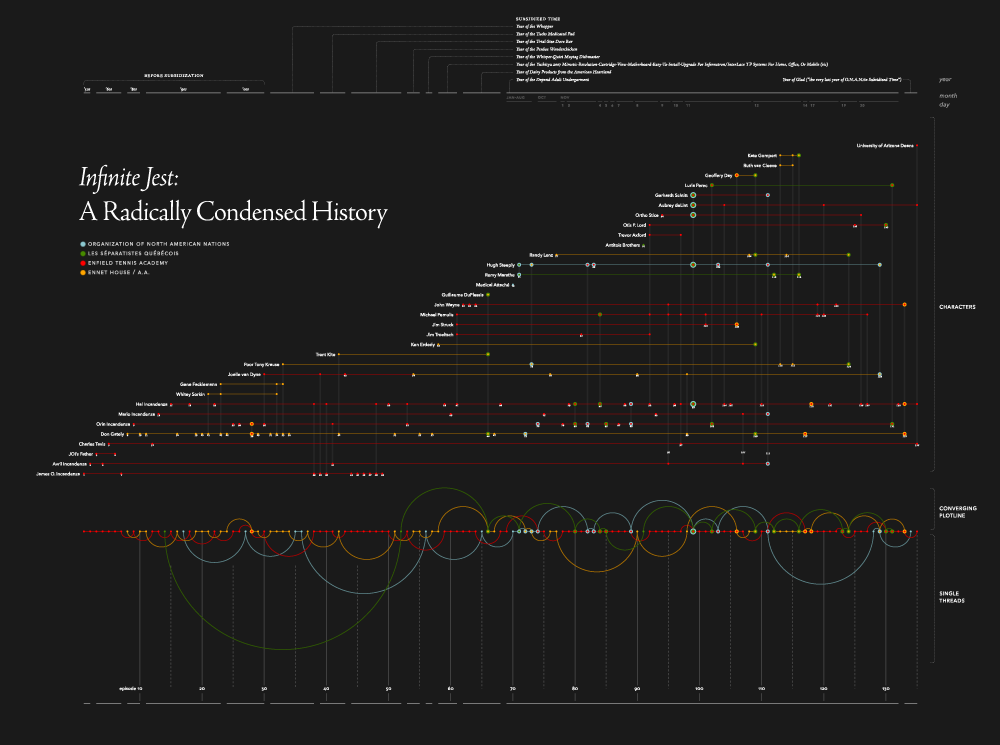
A chronological view of the deeply nonlinear narrative
self-initiatedAsk the Oracle/introspection enabler

| website | oracle.samizdat.co |
| year | 2011 |
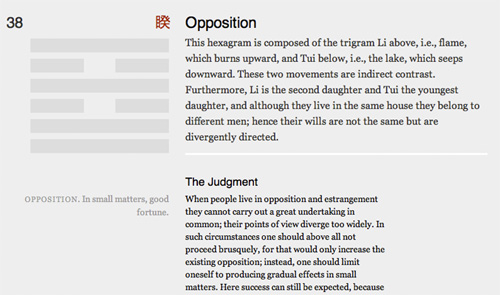
I’ve never been a fan of horoscopes or other forms of divination that provide concrete predictions of the future. However, the use of the I Ching for similar purposes has always intrigued me. By formulating a question and then reading a random chapter (selected by flipping coins or counting yarrow stalks), one’s concerns are ‘answered’, but not in the form of a “you will find love” reassurance. Instead the chapters describe universal situations of conflict into which one can project the current worries and consider the parallels.
The web app begins by asking you to put your concerns into words…

…then picks a random chapter using a software implementation of the yarrow stalk probability scheme.
self-inflictedBDBGS!/The plague this time
| website | samizdat.co/bdbgs |
| year | 2010 |
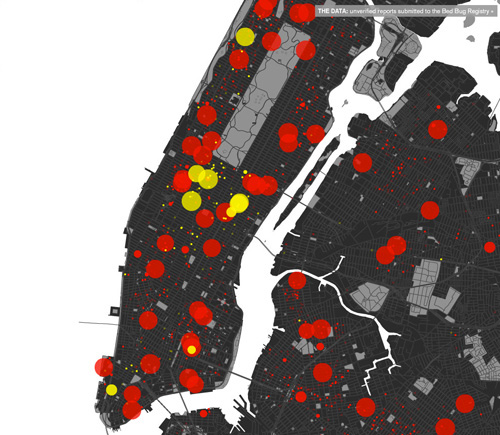
I heard my first horror story about dealing with bedbugs from an acquaintance in Park Slope in 2008. By 2010 I knew closer to a dozen. When they finally came for me I began to wonder exactly how prevalent these pests are in New York (and whether the growth was as explosive as it seemed).
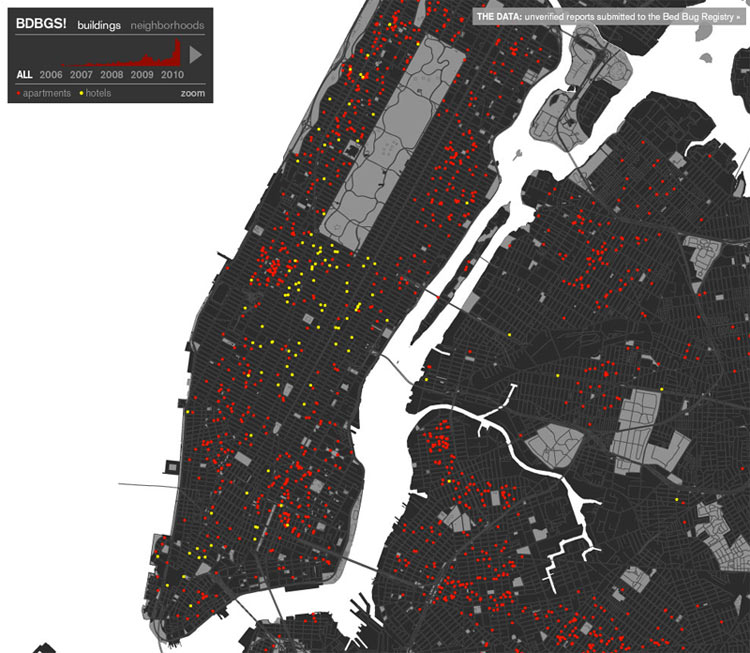
By scraping the data collected at the Bed Bug Registry I was able to map the infestations geographically and over time. Apartments are plotted as red dots and hotels as yellow dots.
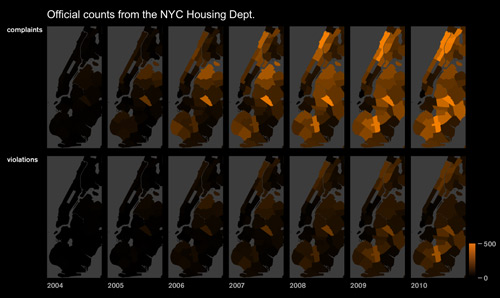
The city’s approach to data collection has been to count the number of calls to the ‘311’ complaint line. As a result the numbers are likely to be a significant underestimate of the problem. Even so, the increase in reports over the past 7 years is dramatic.
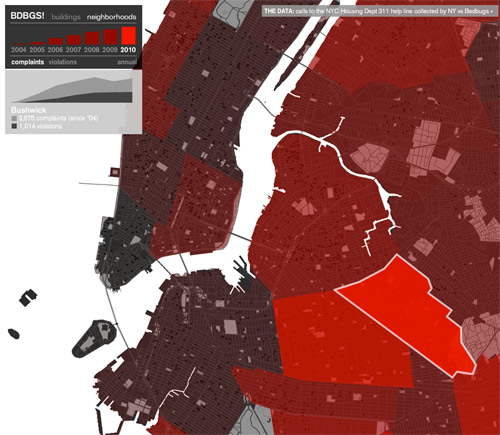
The neighborhood-by-neighborhood map shows the reports waxing and (occasionally) waning over time.
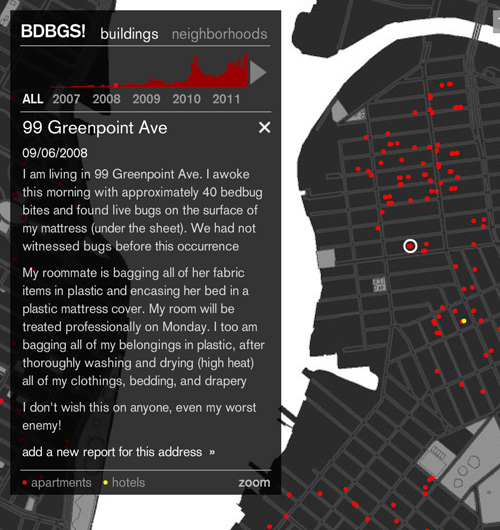
Behind every dot lies a tale of woe, false alarm, or unexpected display of camaraderie.
r.i.s.d.Wikipedia Card Catalog/Bits and atoms changing places

| booklet | see-also.pdf |
| year | 2006 |
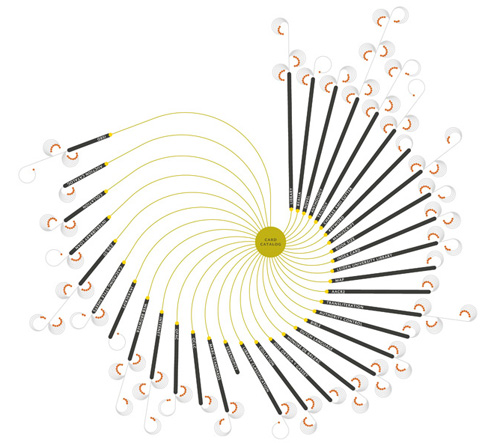
As someone who grew up when libraries were still the densest collections of knowledge available, Wikipedia fills me with both wonder and frisson over what has been gained and lost in the transition to our virtual-everything world. Its digital nature means that the ‘UI’ of the library bookshelf goes out the window. There was a power in being able to see the size of various sections simply by looking at the thickness of a spine. And the serendipitous discovery of related topics through proximity (due to the Dewey or LoC ordering scheme) made for a wondrous form of exploration. I created a card catalog centered on a single entry on wikipedia and expanded out to the documents it linked to. I began with the entry for Card Catalog, following its thrity-some links and creating cards for these child nodes. The second generation expanded even further, yielding nearly four hundred grandchildren to the original article. The children and grandchildren sit side-by-side in the paired drawers of an old cabinet giving a physical read on the rate of expansion in the highly connected network of articles in the database.
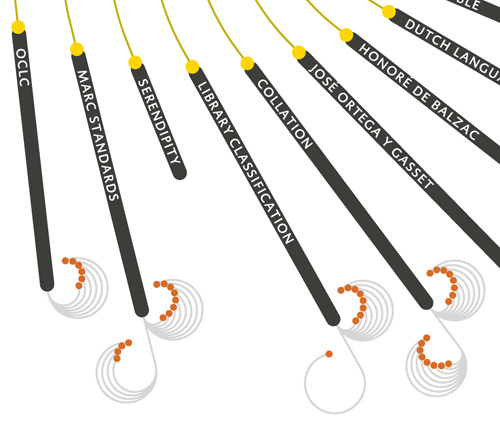
An illustration of the explosive growth of links from one wikipedia page to its children and to its children’s children. Starting with the entry for Card Catalog in the center, all the pages it links to are represented as dark bars stemming off of the original. The links on each of those pages are represented as red dots budding off of the stalks.
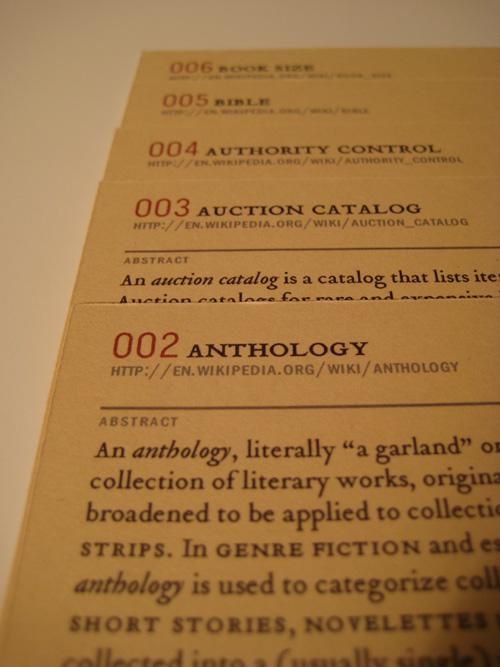
The wikipedia pages linked to from Card Catalog consist of both the expected and the inexplicable.
A card was produced for each wikipedia page listing its abstract and pages linked to in the entry text.
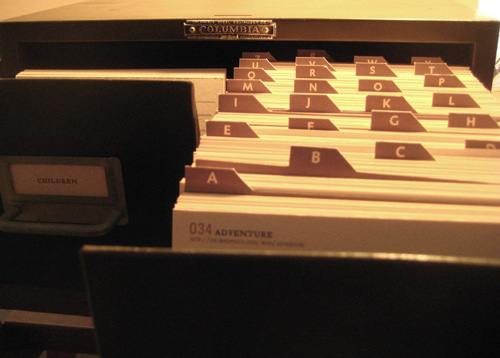
The entry for Card Catalog references 34 child pages directly and those in turn reference 463 other pages. Cards for the child pages are in the left drawer and grandchild pages in the right drawer.
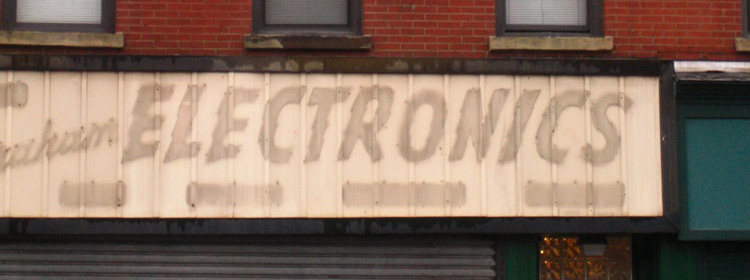
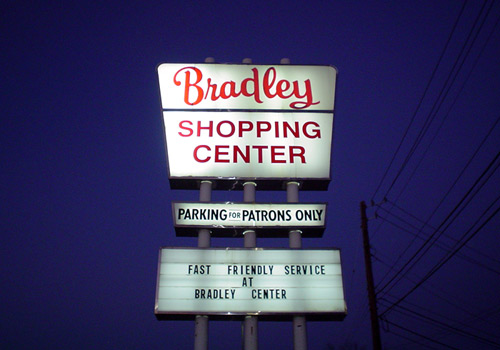
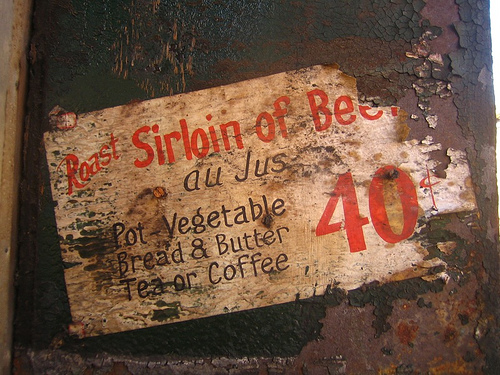
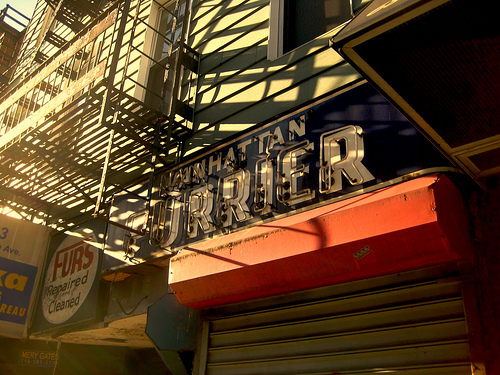
self-initiatedTypography of Neglect/catalog and classify
| website | samizdat.co/neglect |
| year | 2004–2009 |
In 2004 I began what I expected to be a short-lived photography project looking at old signage. To my surprise, this game of hide-and-seek with unique lettering became something of a habit, and since then I’ve been snapshotting my way through every new place I visit. The site collects the first six years of images documenting some thirteen cities, seven countries, and nearly three hundred signs.
r.i.s.d.Fuguestate/Decompiling J.S. Bach
| booklet | music-theory.pdf |
| midi | bwv-578.mid |
| year | 2007 |
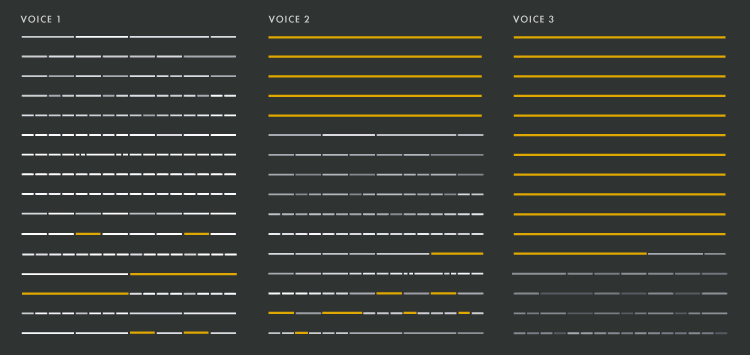
Despite my relative hopelessness when confronted with a musical instrument, I’ve been fascinated by music theory since middle school. The geometric relationships between tones, intervals, and the structure of waves made analytical sense to me, even if it didn’t seem to apply very readily to 13 Songs or Loveless. In college I was blindsided by J.S. Bach whose work perfectly embodies this ‘music is math’ approach to composition. His fugues are both beautiful and dauntingly complex as they layer motif upon motif, building up to emergent juxtapositions you would never predict from the melody line alone. These sketches examine BWV 578: The ‘Little’ Fugue.
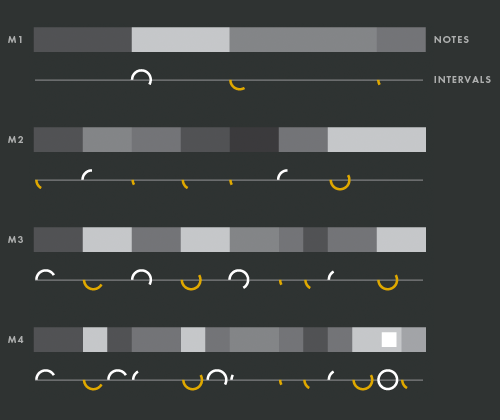
The first four measures of the fugue’s main motif. Notes are represented in terms of brightness in the upper line as time moves left to right. Below, the intervals are drawn as ascending (white) and descending (orange) arcs. The length of the arc shows the proportion of an octave the interval spans.
u.c.s.f.Echolalia/Talking to finches
| applet | samizdat.co/projects |
| year | 2006 |
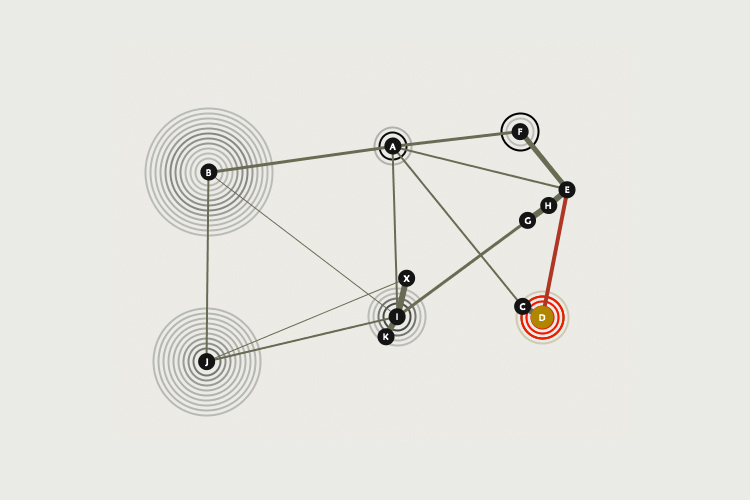
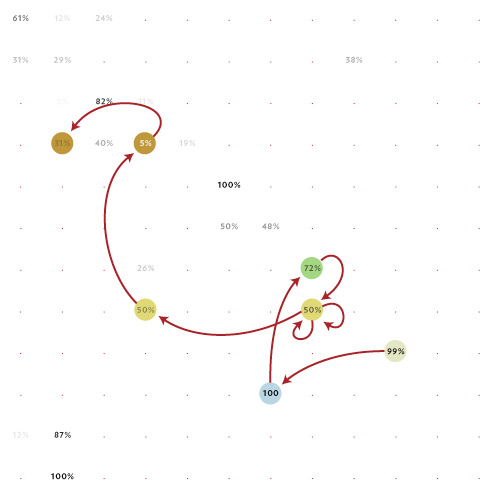
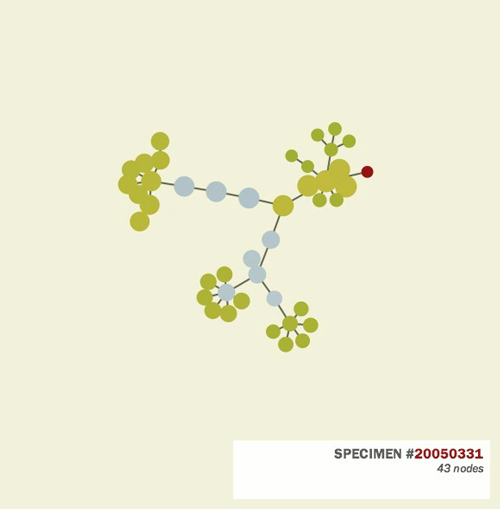
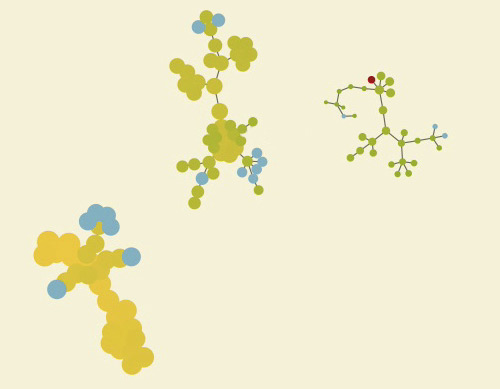
Birdsong is a popular research topic in neuroscience, primarily because it tells us so much about how human brains deal with language. In collaboration with colleagues at the UCSF Keck Center, I created visualizations of the syntax networks seen in the zebra finch. The data broke a bird’s song down into a finite alphabet of syllables sequenced over time. We could then examine the probability that e.g., syllable D would be followed by C vs by E. The diagram above shows the relative likelihoods of different syllable-to-syllable transitions seen in a particular finch’s song.
Once the syllable transition probabilities are known, they can be plotted as a matrix with sources as rows and targets as columns. One can then create a simulated ‘markov’ bird by choosing a starting syllable then flipping a coin to probabilistically jump to one of its likely followers. The arrows at right show one such path.
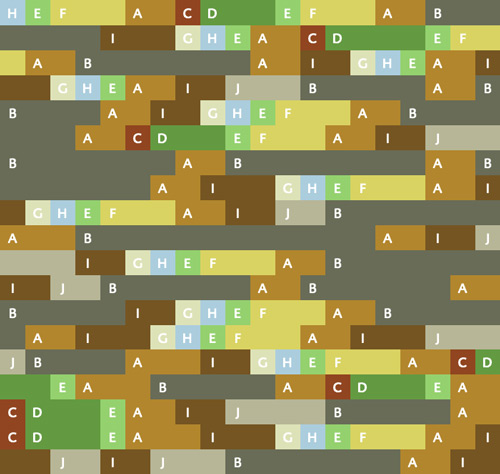
The syllables of a simulated birdsong based on the model. Each syllable is plotted as a colored square and the sequence is read left to right and down. There is a large amount of variation but one can also see repeated motifs.
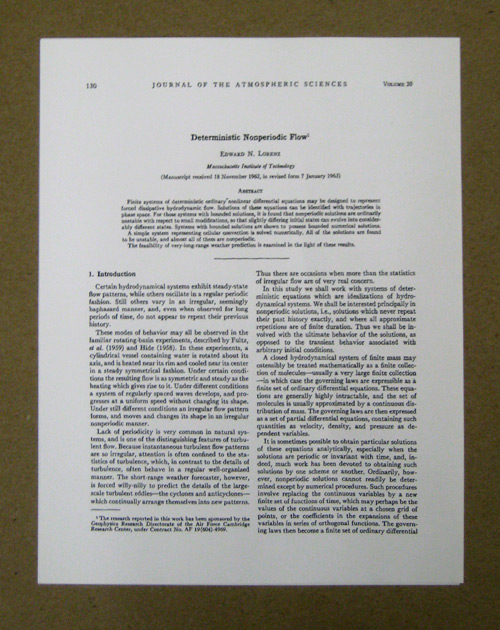
r.i.s.d.Do While/Stop motion screensaver
| citation | lorenz-1963.pdf |
| year | 2007 |
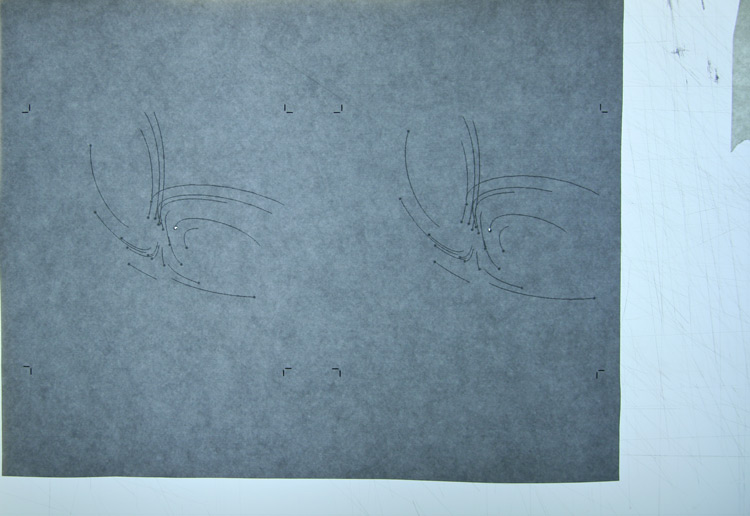
In 1962 Edward Lorenz wrote a paper which more or less created the offshoot of physics variously labeled dynamical systems or chaos theory. Though his subject of inquiry was the sort of convection patterns seen in weather systems (and lava lamps), his conclusions took on a metaphorical life of their own. The paper lives on today primarily for its system of three equations representing fairly abstract fluid dynamics qualities. But given that there were three, he had the insight to map them onto the x, y, and z axes and graph the resulting trajectories in order to understand the dynamics of the system. Particularly interesting to me is their approach involved a computer in running the simulation, but created visualizations of its numerical output with paper and pen. In that same spirit I created a stop-motion video consisting of individual frames of the animation printed on paper then photographed on a light table. Note the hole poked through each sheet for the ‘main’ point in the simulation.
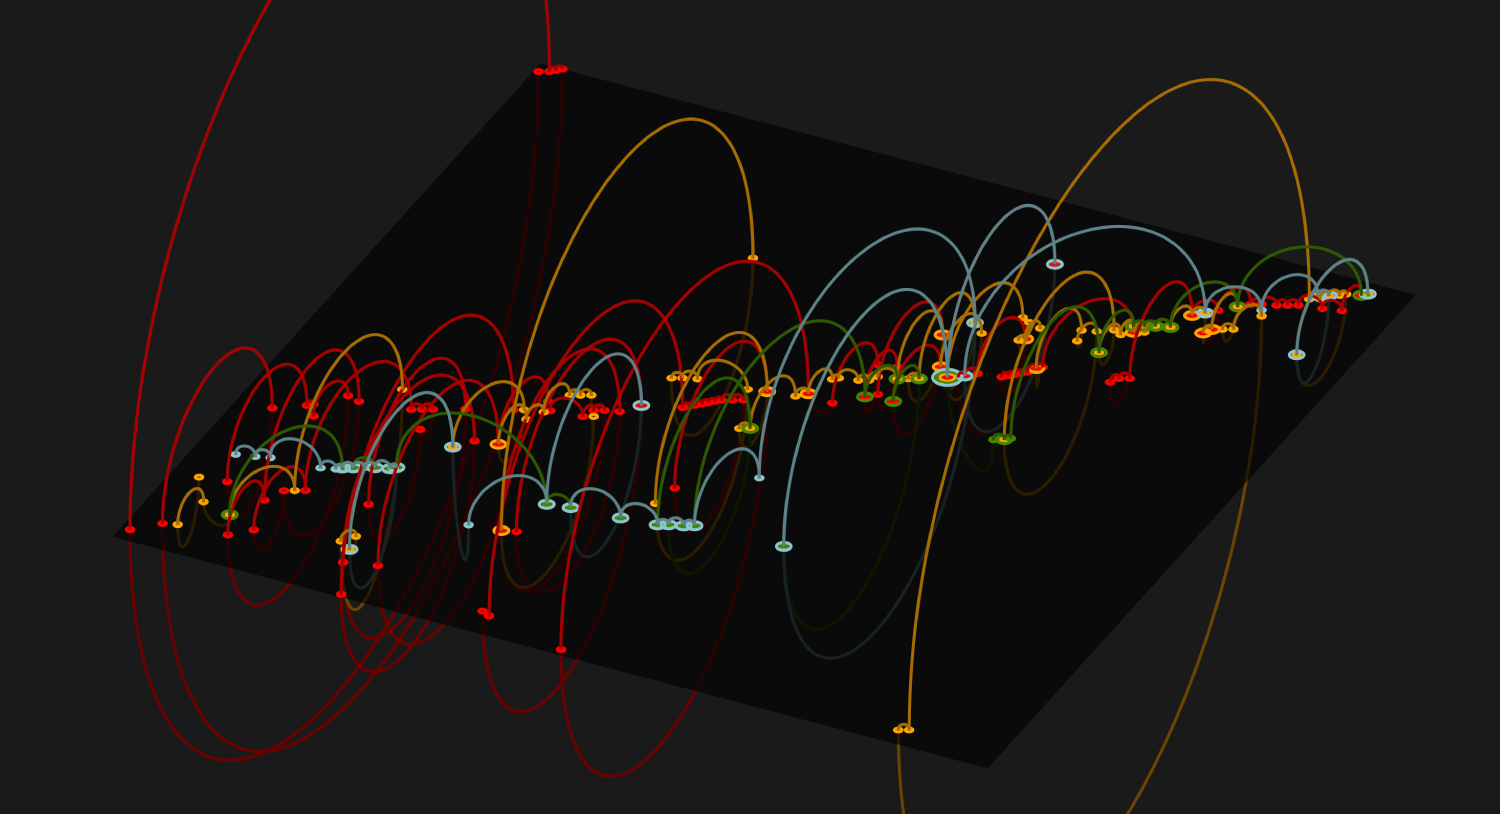
The attractor is an iterated system in which particles’ positions in 3D space are updated based on the differential equations governing the system. Here a number of particles have been stepped through time and trails drawn over their paths. The pair-of-doughnuts structure of the attractor begins to become apparent.
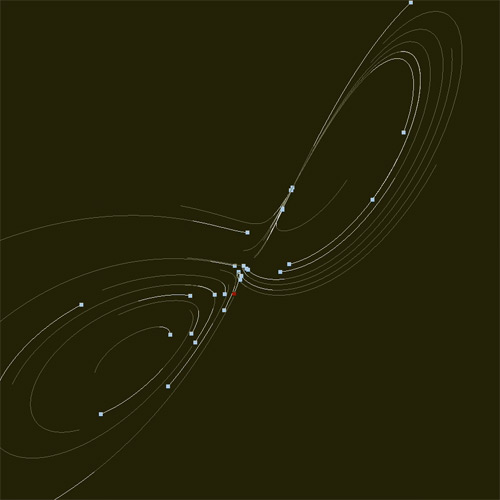
The looping, chaotic behavior of particles in the attractor emerges from deceptively simple equations:
r.i.s.d.Leafnode/Markup botany
| website | samizdat.co/projects |
| year | 2007 |
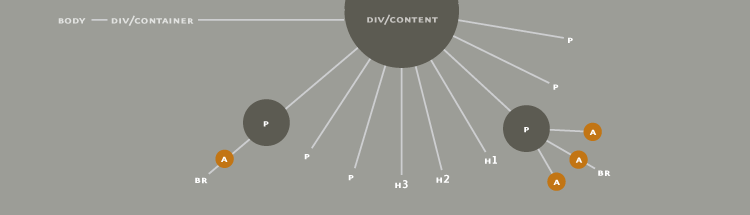
Every web page (including this one) is made up of HTML tags. These tags are nested inside of each other like russian dolls with parent tags containing child tags, grandchild tags, etc. This structure is colloquially called the ‘DOM tree’ by web developers. These animations take the tree suggestion literally and plot the edits over time to one HTML page in terms of branches growing, flowering, and being discarded.
This animation steps through the HTML of the google homepage over many years (and many edits). Structural tags are drawn in blue while more content-oriented tags are drawn in green. The red dot is the body tag from which all others are descended.
r.i.s.d.Fecundity/Wheat, maggots, and cellular automata
| animation | samizdat.co/projects |
| book | fecundity.pdf |
| year | 2006 |
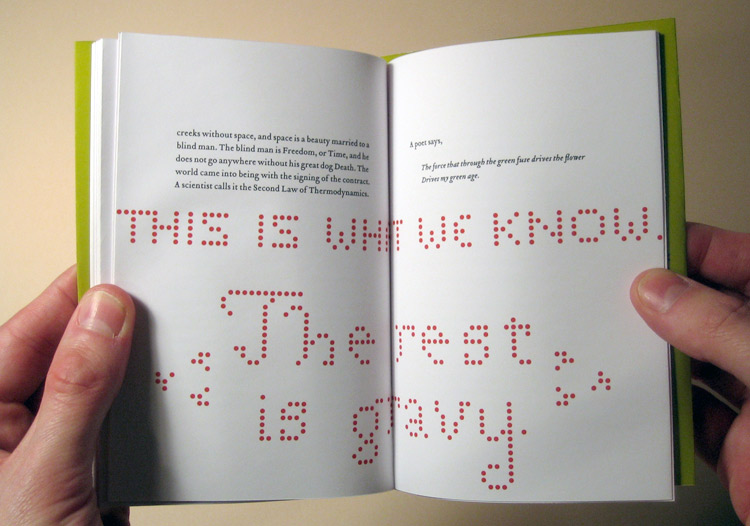
In 1973 Annie Dillard wrote an essay for The Atlantic called The Force that Drives the Flower. In it she explores the strangeness of our relationship to the natural world; a world that our animal natures should make us intimately comfortable with, yet modern life has left us with a profound alienation toward. There is the difference between flora and fauna, most notably our differing reaction to viewing a field with a million blades of grass versus seeing a similar number of cockroaches. But ultimately our lack of understanding comes down to the imposition of our human consciousness (and synthetic concepts such as morality and justice) onto the workings of an uncaring, deterministic system, filling us with dread. Her ultimate message of hope is wry and requires a leap of optimism to embrace: “The scientist calls it the Second Law of Thermodynamics. This is what we know, the rest is gravy.” And indeed this is about the best comfort, albeit cold, that the natural world has to offer: that along the way to the inevitable there will be moments of joy and beauty. And we can savor them all the more since the only guarantee is that they will be rare and transient.
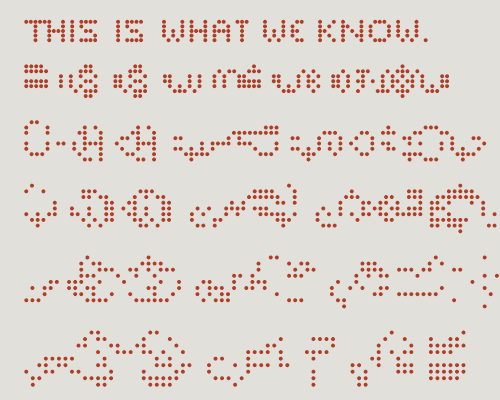
In the book’s margins are a pair of dot patterns which progress in a flip-book fashion as the pages are turned. Their evolving shapes are directed by the rules of Conway’s Game of Life as applied to the pixel-lettered messages on the first and final pages.
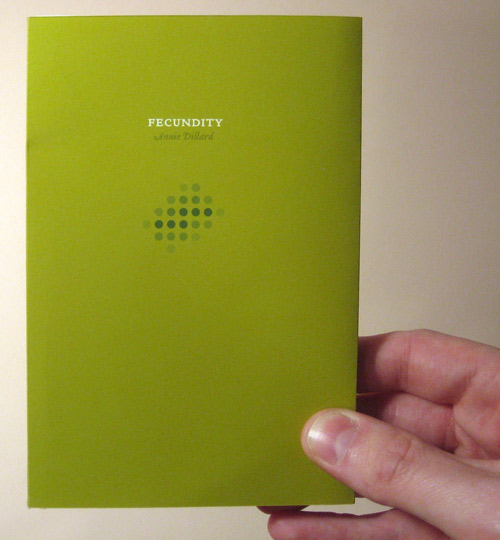
One of the more interesting ’creatures’ in the Game of Life is a self-replicating structure called the Glider. The book’s cover design incorporates a diagram superimposing the different stages of the glider’s progression.
r.i.s.d.Textiles/Punchcard patterns
| year | 2005 |
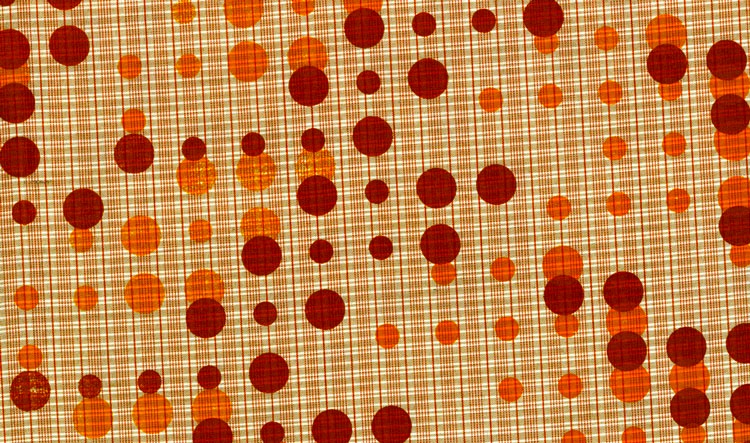
I’ve always been a sucker for repeating patterns and am known to dabble in surface design. Above is a pattern composed of (little-endian) binary representations of the numbers one through seventeen. Zeros are small dots and ones are large.
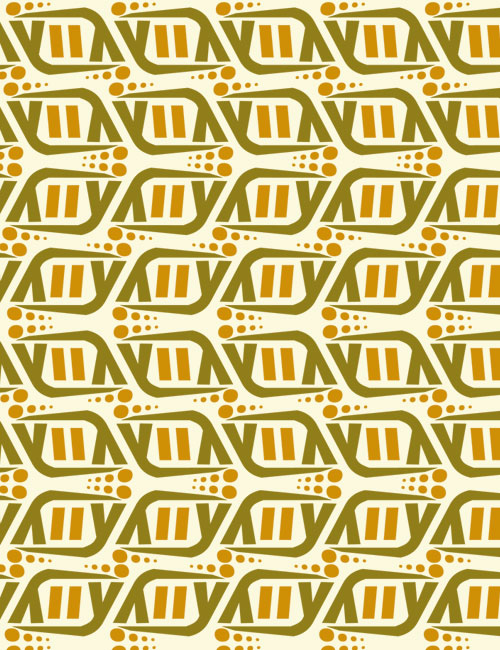
A pattern inspired by an indian soda bottle design I spied in a friend’s photograph.
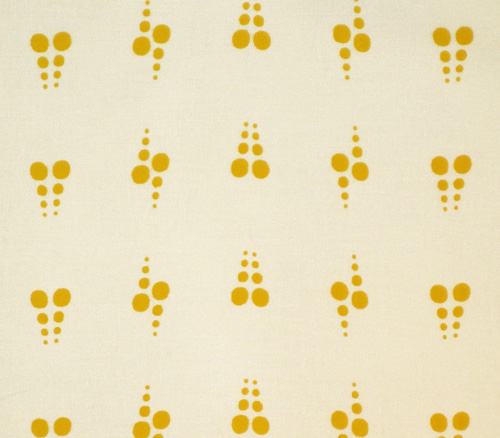
Fabric screenprint with just the dots from the soda design.
r.i.s.d.Posters/Making print
| year | 2005–2008 |
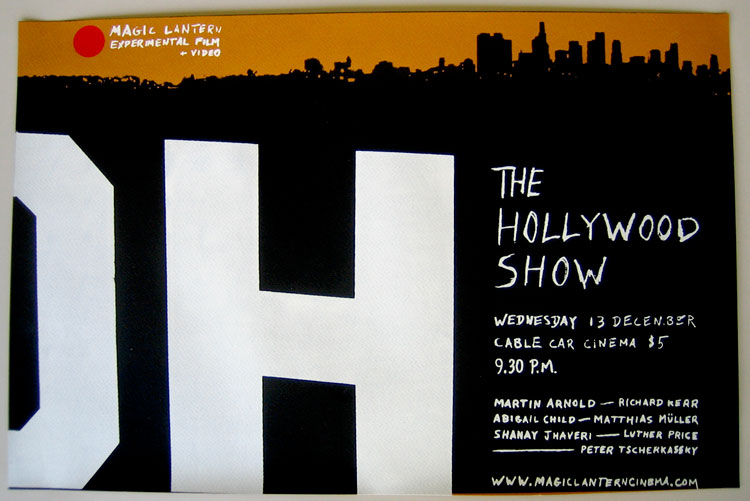
A silkscreened poster for a showing of the Magic Lantern experimental film series in Providence, R.I… Made by hand in an edition of 100; printed in 3 colors on bright orange paper.
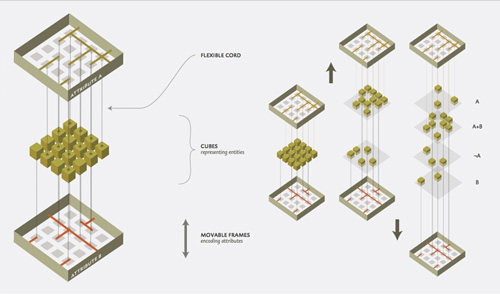
Schematics for an analog, mechanical database system using the Prehensile Query Language. Binary attributes could be associated with entities within the ‘database’ through elastic bindings to movable frames.
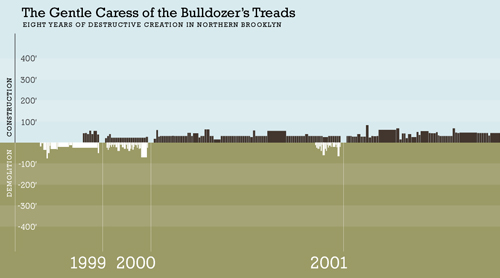
A graph of construction and demolition in northern brooklyn during the bubble years. Data was scraped from the NYC Buildings Dept. View the full poster.
A pair of pilcrows; one made with ink, the other with wallpaper, super77 and soil.

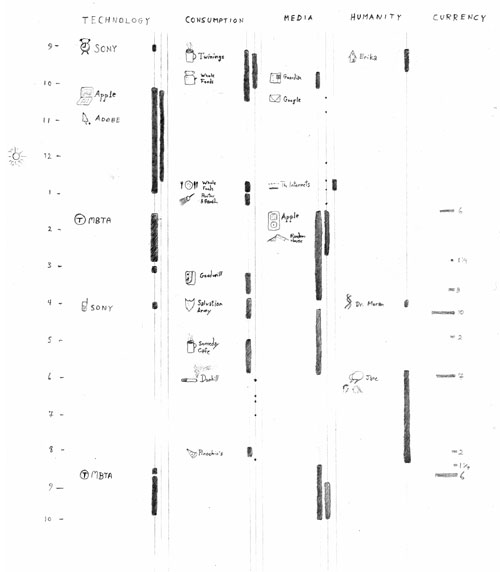
A daylong journal of my consumption in terms of both money and attention. Download an auralization of the resulting data where the bars are mapped to notes and the day is played as if it were a piano roll.